Aggregating data across test zones
Module, inverter, mounting, storage product and storage system zones needed consistent data definitions.


Renewable Energy / Demonstration Testing
For a large solar and storage demonstration test base, an integrated platform covering 3D overview across test zones, demonstration data aggregation, comparative assessment and meteorological observation.
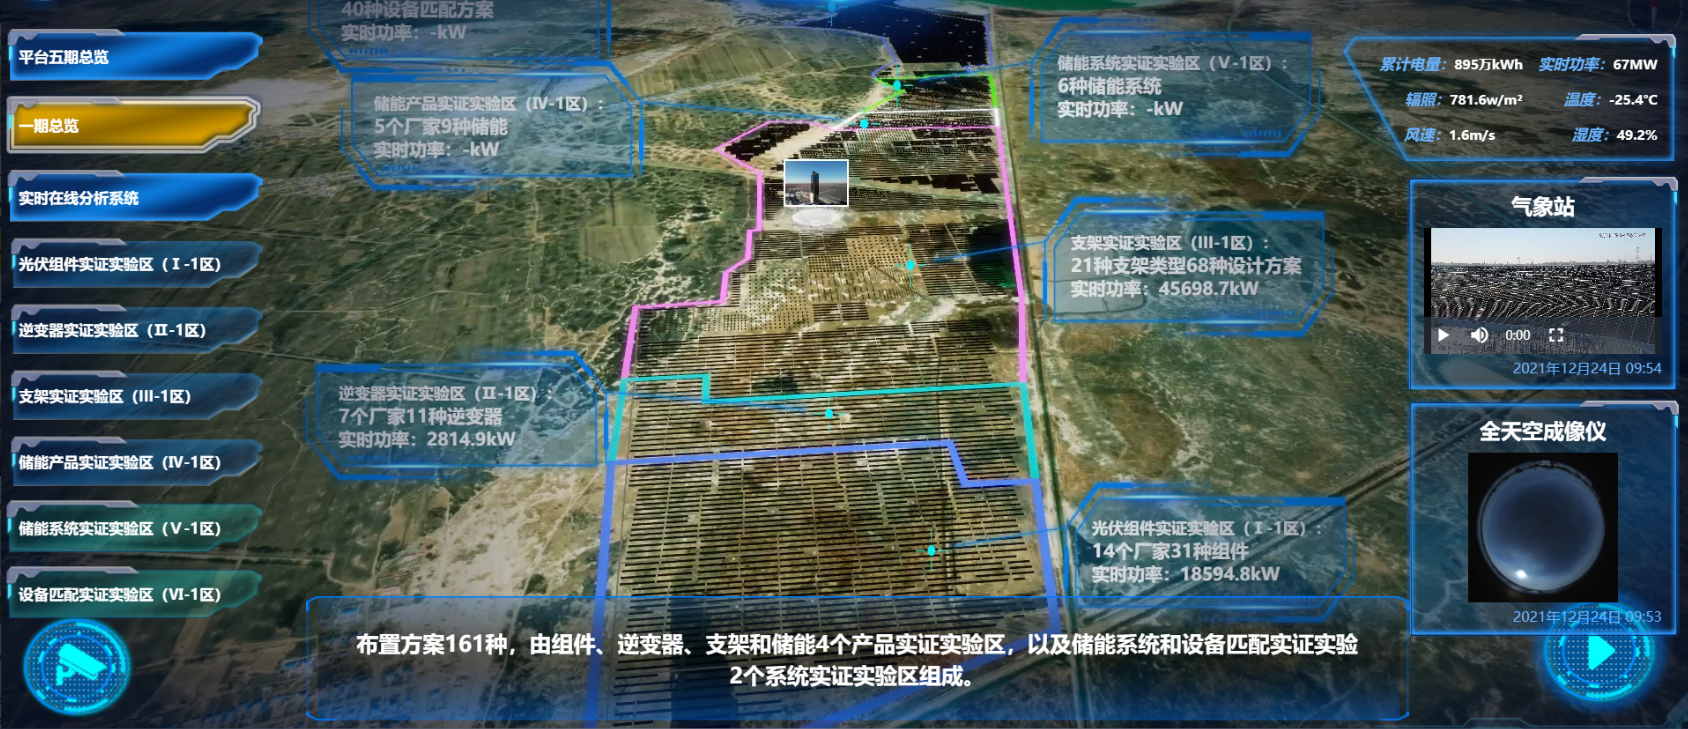
Under client confidentiality agreements, this page omits client names, locations and real production data; screenshots are anonymized and serve only to illustrate the engineering experience gained.
Project background
Modules, inverters, mounting systems and storage test zones run in parallel across the base with a large number of layout configurations, and demonstration data, meteorological observation and assessment analysis had no unified platform.
Module, inverter, mounting, storage product and storage system zones needed consistent data definitions.
Generation performance across hundreds of layout configurations had to be comparable under identical environmental conditions.
Irradiance, temperature and wind observations had to align with operational data to support demonstration conclusions.
Our scope
This page shows only the key delivery content; the commercial scope is governed by the signed project documents.
Organized the base, test zones, layout configurations and live operating status in a 3D view.
Unified ingestion of power, energy and historical series across test zones.
Supported performance comparison and assessment across vendors and configurations under equivalent conditions.
Ingested weather station and whole-sky imaging data, aligned with operational data.
System chain
The diagram is an anonymized summary, showing the main objects and technical relationships in the project.
Core engineering challenges
Project experience is not just finished feature pages — it is handling site constraints, data quality and long-term operation.
Data was organized around test zones and layout configurations, enabling precise comparison between approaches.
Unified time definitions across operational data and meteorological observation kept demonstration conclusions trustworthy.
The 3D view carries live status and key metrics across many test zones and configurations.
Business capabilities gained
Test zones, layout configurations, live power and environmental status enter a single 3D view.
Comparison rests on unified data definitions and synchronized environmental observation.
Long-run demonstration data becomes a reusable basis for analysis and research.
Transferable experience
Project consultation
Tell us the business problem to solve, your existing systems and the outcome you expect — we usually reply within 1 business day.